by Andru McCracken
There is a new map of Valemount and while it won’t tell you how to get from one place to another, it may help you decide where you’d like to live. The map is of the dispersion of wood smoke throughout Valemount during a cold week in February. Taken over six days, the map helps show how smoke is typically distributed through Valemount during an inversion.
Student Matt Wagstaff developed the mobile smoke collection project as a part of his masters thesis in Occupational and Environmental Hygiene at UBC’s School of Population and Public Health.
Wagstaff and a team of volunteers drove particulate sensing equipment around Valemount everyday for a six days in a row in early February. Conditions were typical of cold smoky nights with lows of roughly 20 degrees below zero and very little wind.
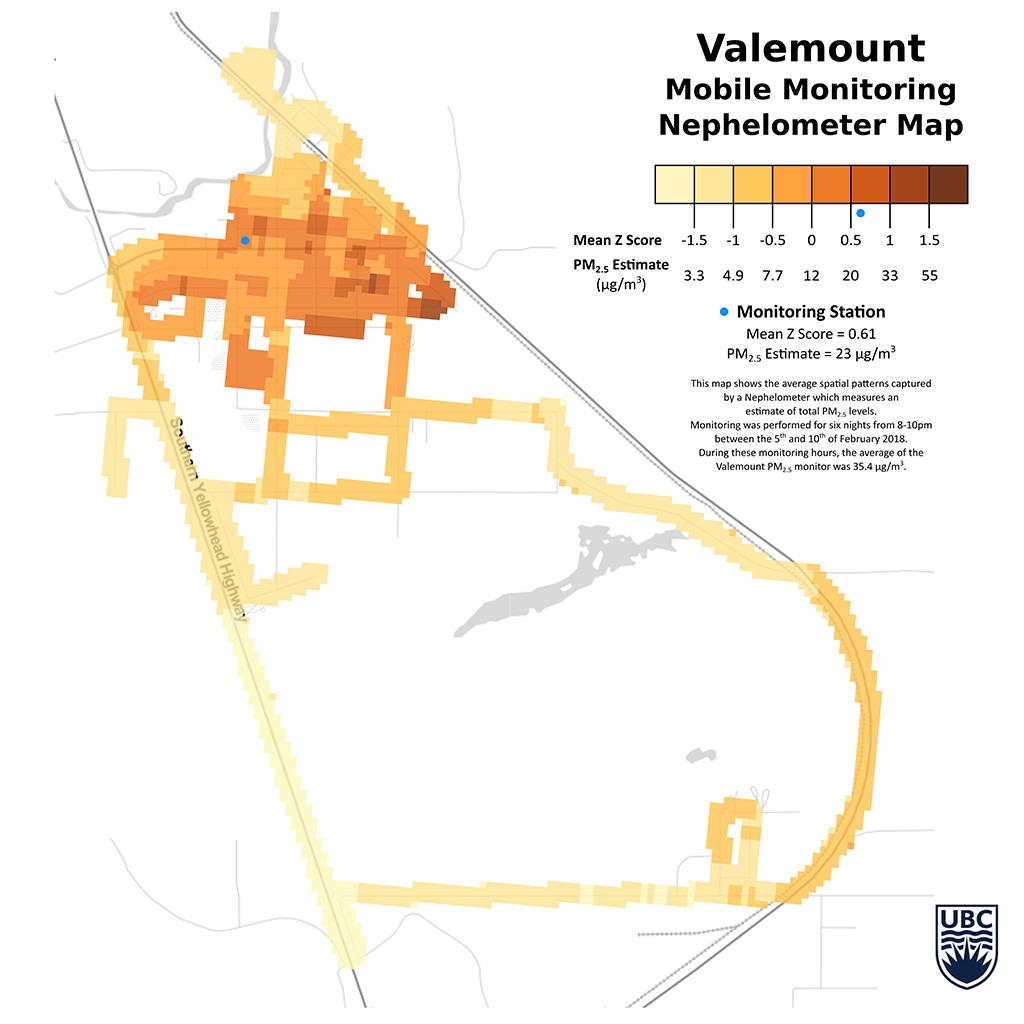
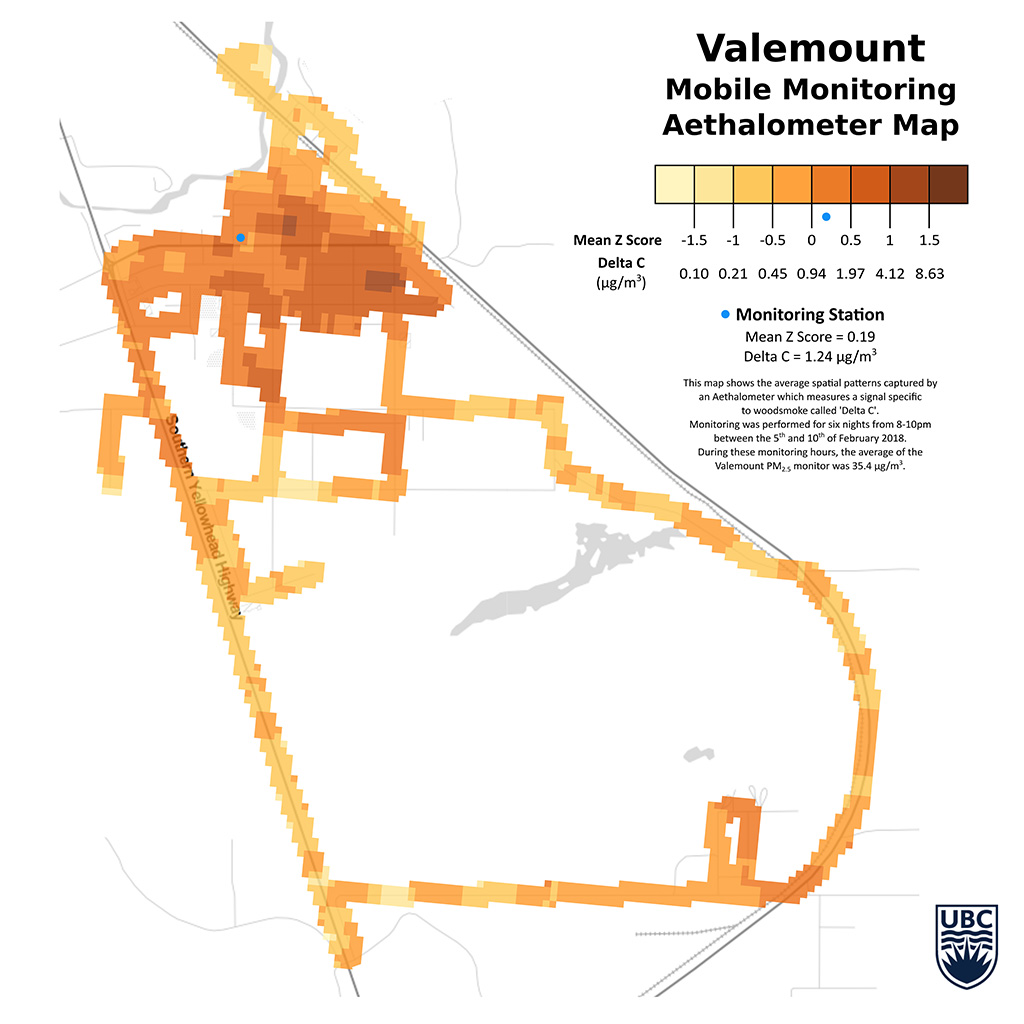
In both maps the data gives a sense of how woodsmoke is distributed around Valemount. Darker areas show a higher concentration of smoke. Less populated areas like the western extent of Main Street show very little smoke compared to Beavan Crescent for example. Math whizzes should look at the map in detail as the colours indicate standard deviations.
The two maps show slightly different results because different techniques and instruments were used. One specifically looks for a marker unique to wood smoke, while the other simply looks for small noxious particulate known as PM 2.5, which could be generated from other sources besides wood smoke.
As reported previously, Valemount has the worst air quality of any community in the province. Some community members wondered if the air quality was just particularly bad near the monitor (which sits atop the Valemount Firehall). The maps indicate smoke is a widespread issue throughout the community.